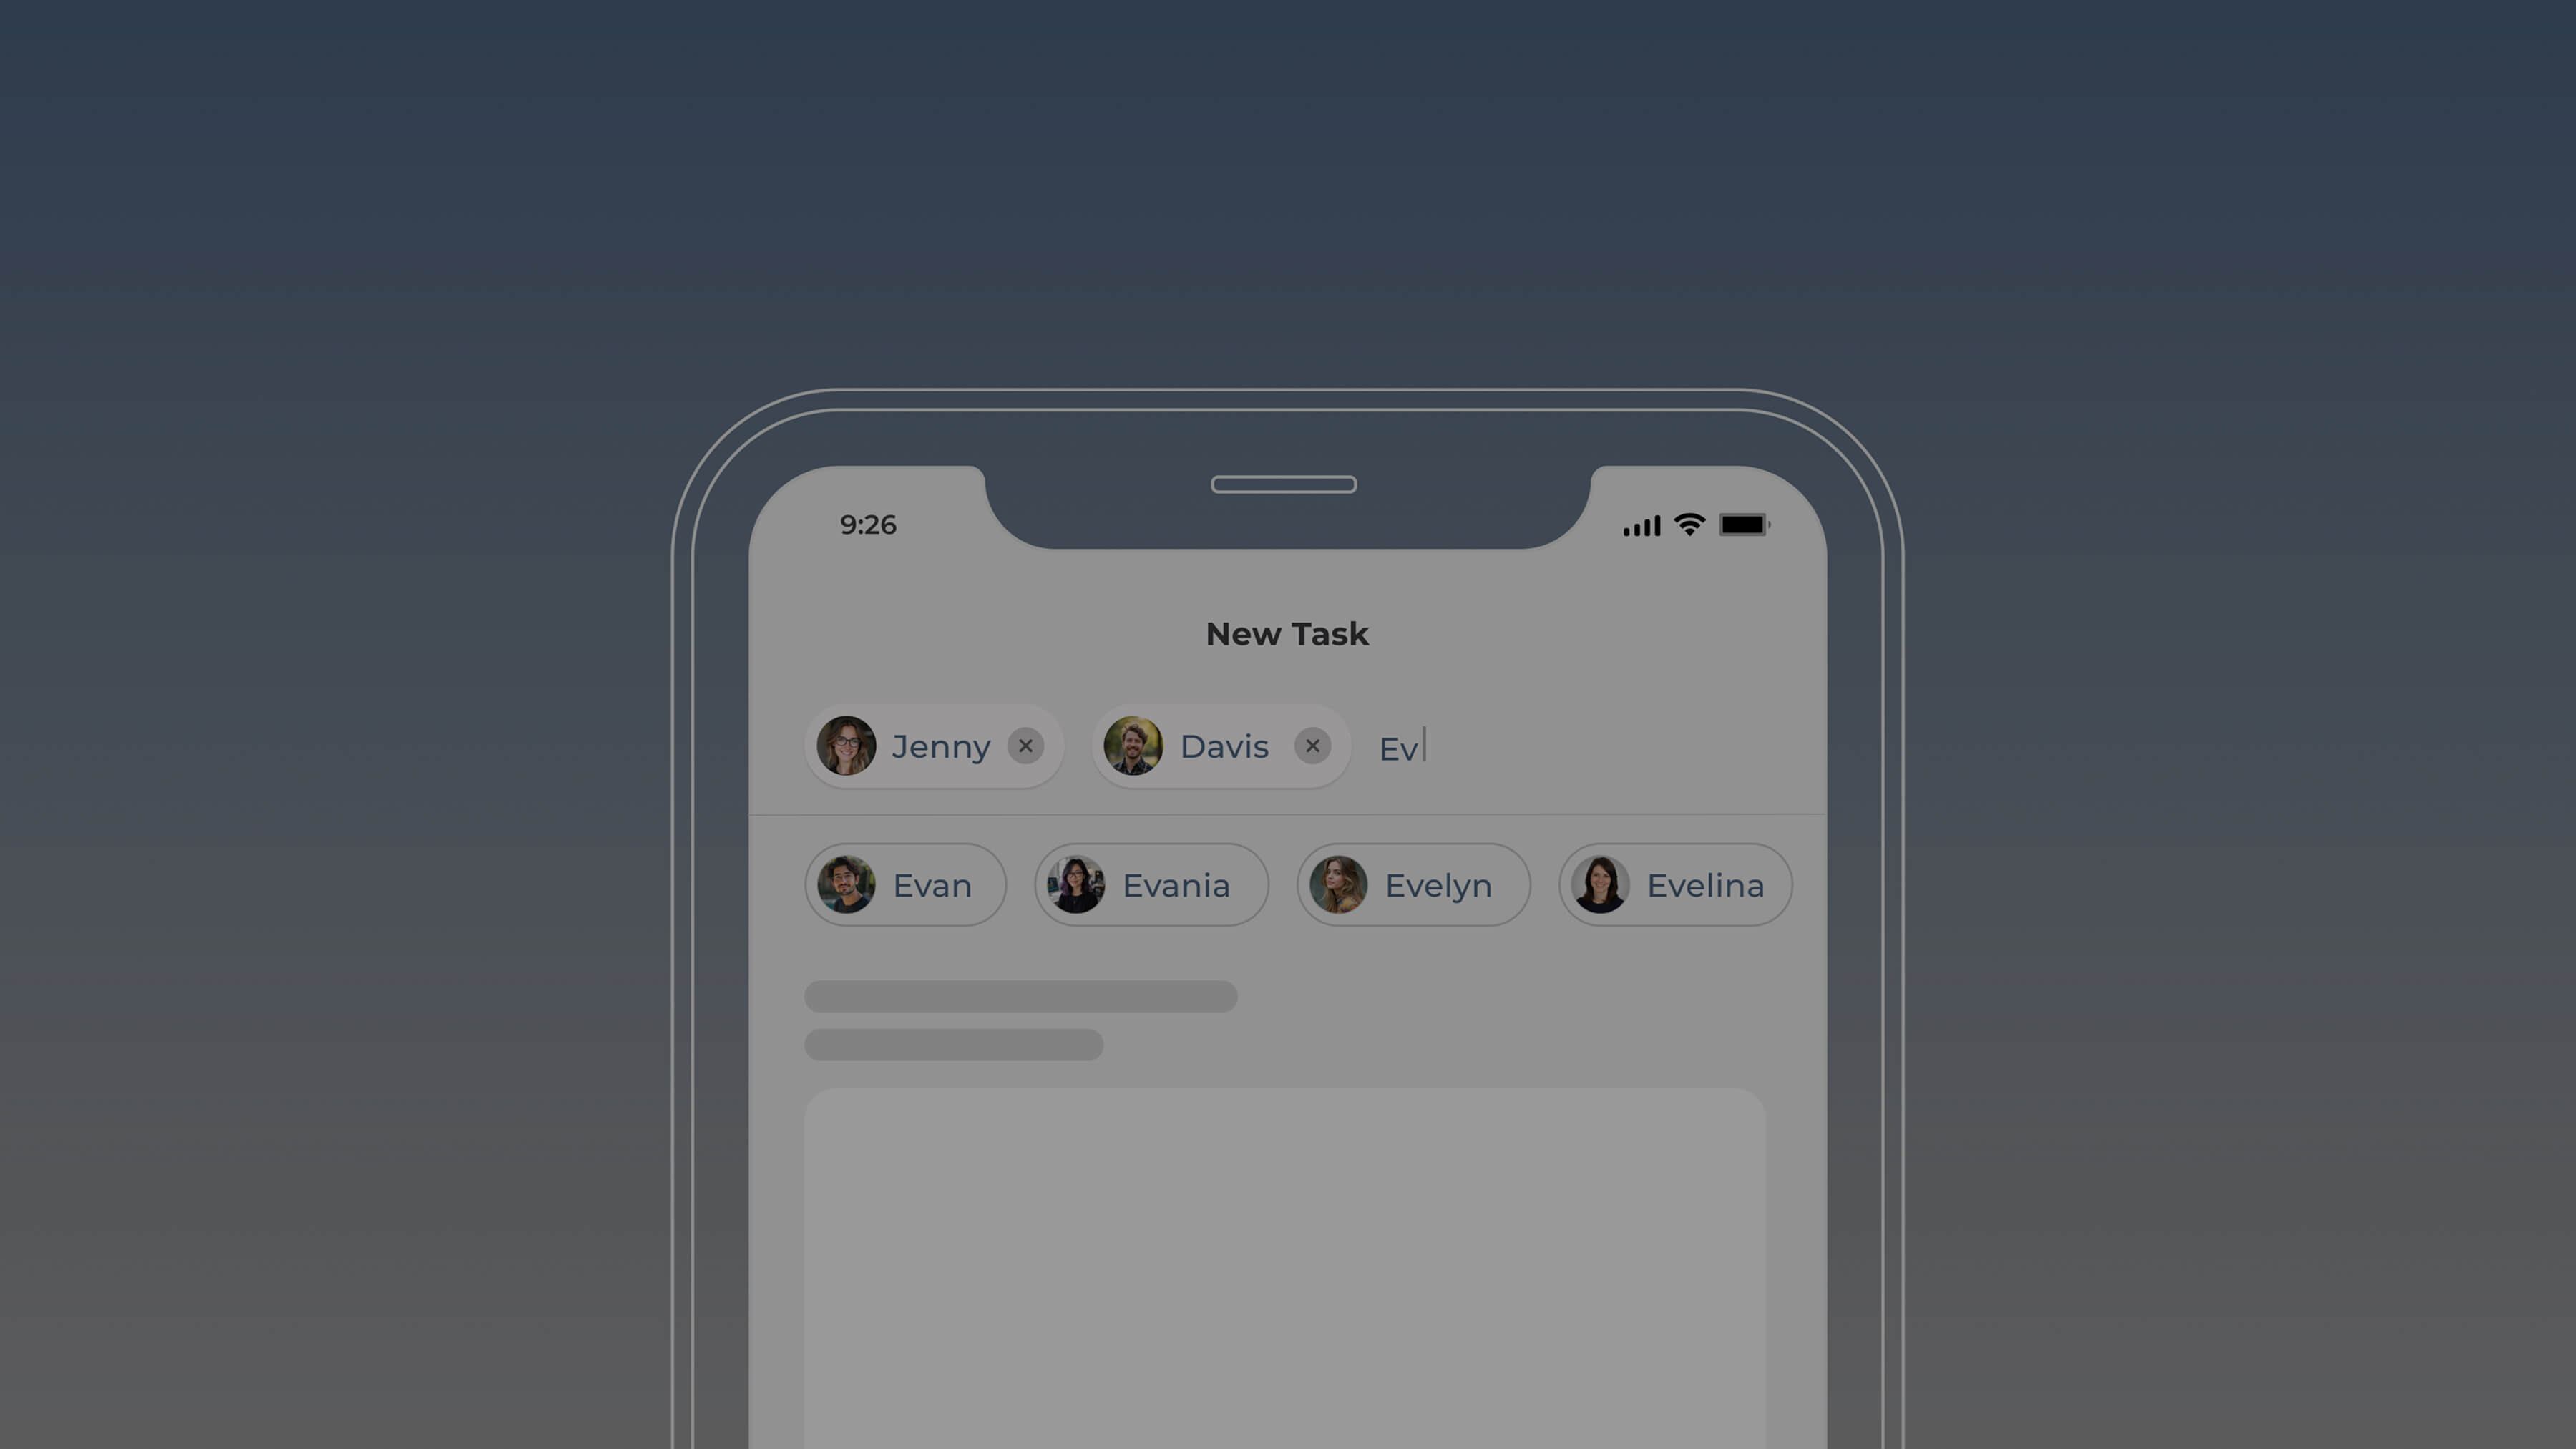
Agile Marketing Engine

Designed a scalable multi-brand loyalty platform enabling seamless rewards, stronger customer retention, and improved brand engagement.
Digital Scribe Assistant

Built AI-powered transcription integrated with EMR, streamlining documentation, improving accuracy, and enhancing healthcare provider efficiency.
Scaling Empathy with AI

Implemented AI tone detection to automate customer support, improving response accuracy, empathy, and overall service quality.
End-to-End Data Visualization Solutions for Insightful, Actionable Business Intelligence
Partnered with us :
- Visualization Strategy and Tool SelectionChoose the right tools and platforms from Power BI and Tableau to Looker, Metabase, or custom web dashboards.
- Dashboard Design and DevelopmentDesign intuitive, responsive dashboards using visual best practices that prioritize clarity, usability, and real-time relevance.
- Data Structuring and Chart MappingMap data fields and relationships into meaningful charts and layouts tailored to business logic and end-user needs.
- Embedded and Mobile VisualizationsCreate visual experiences that work within your products, mobile apps, or internal portals with real-time data refresh.
- Training and Adoption SupportEnable your teams to explore, interpret, and use data with ease through guided documentation, onboarding, and iterative enhancements.
Partnered with us :
Practical Applications of Generative AI Integration

Customer and Agent Portals Redefining Insurance Experiences
Enhanced customer engagement and agent efficiency with secure, scalable digital portals.

Power BI Dashboards Transforming B2B SaaS CRM Reporting
Delivered real-time business intelligence through interactive dashboards enhancing decision-making.
Built with the Right Stack, Engineered for Impact
From performance to scalability, the right tech stack makes all the difference. We build with proven frameworks to deliver secure, fast, and future-ready solutions.
FRONTEND
User-facing layers that bring GenAI experiences into your product’s UI with clarity and responsiveness.
ReactJS
Angular
Vue.js
Next.js
Nuxt 3
BACKEND
Infrastructure that powers GenAI logic, data flow, model orchestration, and secure system interactions.
Python
Grafana
ELK Stack
Datadog
Prometheus
Data Visualization Turns Complex Data into Business Clarity
We turn raw data into visual clarity with data visualization consulting that accelerates decisions and drives growth.

Data Visualization Turns Complex Data into Business Clarity
We turn raw data into visual clarity with data visualization consulting that accelerates decisions and drives growth.
WHY CHOOSE US?
- End-to-End GenAI System Integration
- Real-Time Data & API Connectivity
- Scalable, Secure Architecture by Default
- Seamless Frontend and Backend Deployment
- Cross-Functional Team Expertise
- UX-Led Feature Embedding Expertise
Partnered with us :

Results & strategies from projects that drove success
Every challenge taught us something. Every solution made a difference. Explore case studies and white papers that capture the results we've achieved together with our clients.
FAQ

Get in touch
Drop us your requirements, and we’ll come back with a clear plan on how we can support you.
“Choosing Cubet was the turning point in our project.”
Tech lead, Jendamark
"Working with Cubet felt like adding an extension to our core team."
CTO, SNO
"They understood our goals better than we did."
CEO, Trust Cyprus
“Choosing Cubet was the turning point in our project.”
Tech lead, Jendamark
"Working with Cubet felt like adding an extension to our core team."
CTO, SNO
"They understood our goals better than we did."
CEO, Trust Cyprus

Hear from our clients about their experience!

Get in touch
Kickstart your project
with a free discovery session
Describe your idea, we explore, advise, and provide a detailed plan.


